You are viewing a read-only archive of the Blogs.Harvard network. Learn more.

Is England trying to make a divorce less painful?

England has a reputation around the world for awarding generous payouts to the financially weaker party in a divorce. A prenuptial agreement (or “prenup”) is not legally binding in England, and judges have extremely wide discretion when deciding how assets should be divided upon divorce.

Although increasingly rare, English courts can grant a type of financial award dubbed a “meal ticket for life” by critics. Compared to England, financial awards made in other jurisdictions in Europe and elsewhere in the world are generally much more limited, and if there are maintenance payments, there would be a time limit. According to the Financial Times:

In cases where there is not enough money for a one-off divorce settlement payment, courts have the option to award ongoing maintenance payments as well as lump sum awards. Judges have often awarded so-called joint lives maintenance to the financially weaker spouse, which means they receive annual payments for the rest of their life.

English courts are unusual in awarding open-ended maintenance orders. In Scotland, which has a separate legal system, maintenance is only usually payable for three years following a divorce, after which it is assumed the spouse will get a job and become self supporting. In France the maintenance period lasts eight years and in Norway and Greece it is usually three years.

But that may be changing soon in England.

The shift comes amid moves to reform the Matrimonial Causes Act 1973 — which deals with financial provision in divorce settlements — to create greater legal certainty and reduce reliance on judicial discretion to make maintenance orders.

Baroness Deech, a cross-bencher in the House of Lords, is seeking urgent reform of the law and wants a financial cap to be placed on most open-ended maintenance payments. “The proposal to put a limit on maintenance reflects what is happening in Scotland and other jurisdictions,” she said.

Her Divorce (Financial Provision) Bill had its third reading in the House of Lords in December and has now passed to the Commons. It includes a provision that would limit maintenance payments to five years except in exceptional circumstances.

The Bill also allows for prenups (and postnups) to be binding rather than persuasive as they currently are in England. The time limit of maintenance and the legal recognition of prenups, taken together, seem to disadvantage the financially weaker party of a marriage, usually the wife.

From another perspective, it leaves less discretion to judges and more certainty to the outcome. There may be improved “efficiency” in the event of a divorce, saving the couples time and money in fighting a lengthy emotional legal battle. Hopefully, this would make a divorce a little less painful.

Why rich people work longer hours

The Economist has a new article asking why rich people work longer hours than the poor nowadays. According to them:

… the rich have begun to work longer hours than the poor. In 1965 men with a college degree, who tend to be richer, had a bit more leisure time than men who had only completed high school. But by 2005 the college-educated had eight hours less of it a week than the high-school grads. Figures from the American Time Use Survey, released last year, show that Americans with a bachelor’s degree or above work two hours more each day than those without a high-school diploma. Other research shows that the share of college-educated American men regularly working more than 50 hours a week rose from 24% in 1979 to 28% in 2006, but fell for high-school dropouts. The rich, it seems, are no longer the class of leisure.

The article then gave two key explanations. The first one is the substitution effect: higher wages make leisure relatively more expensive, so rich people are unwilling to rest; this is compounded by the “winner-take-all” nature of modern economy. The second is simply that the “leisure” by the poor are involuntary. In order words, they are just “forced” not to work, although they would want to work more.

Increasing leisure time probably reflects a deterioration in their employment prospects as low-skill and manual jobs have withered. Since the 1980s, high-school dropouts have fared badly in the labour market. In 1965 the unemployment rate of American high-school graduates was 2.9 percentage points higher than for those with a bachelor’s degree or more. Today it is 8.4 points higher. “Less educated people are not necessarily buying their way into leisure,” explains Erik Hurst of the University of Chicago. “Some of that time off work may be involuntary.”

I have blogged on the “busy trap” here last year (Part I and Part II), and have asked the same question. One finding that I made was that working hours did not actually decrease much in most OECD countries in the past twenty years, although GDP has grown substantially in all of them. I asked whether “these highly-efficient people [are] just more determined to go an extra mile and are more willing to push themselves to the limit”, and I think I can better answer this question now.

To begin, part of the explanations are personal. Many times, we just hate to be idle; we want our schedule to be full everyday, every minute. This is particularly true for the over-achievers (I have seen many of these people here at Harvard), and it is likely these are exactly the same people who are rich. To these people, there are social and peer pressure to just keep themselves busy. There is a stereotype of what “successful” people should look like: always on the BlackBerry, always doing something, always “needed” by someone.

But many of the reasons are institutional too. Those investment banking and consulting jobs that Ivy League students from all sorts of background wanted to get so much are hardly 9-5 jobs. You just cannot “choose” the number of hours that you work, even if you prefer (slightly) less pay but shorter hours. Either you take the job and work long hours, or you quit; there is hardly any middle ground. Furthermore, when most of the economy’s output are now in “services” rather than “goods”, there are problems in measuring and monitoring productivity. Is a “service” that you finished in seven hours necessarily better than that finished in one hour? Not necessarily, and it is hard to tell, but it is easy for a service provider to claim more revenue for the extra hours that they put in. This creates perverse incentive for lawyers (say) to create more complications for their clients. At the end of the day, services are mostly transaction costs of the economy, but when we profit from these friction, we have little interest in eliminating them. Indeed, we would want to increase them.

Too-big-to-fail: Still there

One simple graph by the Thomas M. Hoenig, Vice Chairman of the U.S.’s Federal Deposit Insurance Corporation (FDIC) on how big banks (defined as those with assets over $10 billion) in the U.S. have become bigger and bigger in the past three decades.

Simon Johnson summarizes his observations nicely:

The facts may startle you. In 1984, the US had a relatively stable financial system in which small, medium, and – in that day – what were considered large banks had roughly equal shares in US financial assets… Since the mid-1980’s, big banks’ share in credit allocation has increased dramatically – and what it means to be “big” has changed, so that the largest banks are much bigger relative to the size of the economy (measured, for example, by annual GDP). As Hoenig says, “If even one of the largest five banks were to fail, it would devastate markets and the economy.”

I would add that the market share of the biggest banks have doubled since the late 1990s, when the financial deregulation in the U.S. took place under Robert Rubin and Larry Summers. Despite a short dip during the 2008-09 financial crisis, the growth trajectory in assets by these biggest banks have already resumed. In short, big banks are still getting bigger and bigger, which would make regulators’ determinations to end too-big-to-fail incredible. And the reform may be starting to lose momentum. As Hoenig said:

[M]uch remains undone and I suspect that 2014 will prove to be a critical juncture for determining the future of the banking industry and the role of regulators within that industry. The inertia around the status quo is a powerful force, and with the passage of time and fading memories, change becomes ever more difficult.

Cantonese in Hong Kong: Not the official language?

Hong Kong’s Education Bureau has caused a furore last month by claiming on their website that Cantonese is just a “Chinese dialect” and “not an official language” of Hong Kong. According to them:

Although the Basic Law stipulates that Chinese and English are the two official languages in Hong Kong, nearly 97 per cent of the local population learn Cantonese (a Chinese dialect that is not an official language) as their commonly used daily language.

This has, undoubtedly, led to outrage in Hong Kong, where the overwhelming majority speaks Cantonese as their mother tongue and in their daily life. The Education Bureau apologies shortly afterwards, and took the relevant text off their website. Many people have already make good arguments on why Cantonese is not just a dialect, and I am not going to repeat them here.

I just want to do some math here, and present a simple line of logic. The law says that “Chinese and English” are Hong Kong’s official languages, but there is no rule about verbal language, such as Cantonese. If, however, as the Education Bureau claims, Cantonese is just a “dialect” and “not an official language,” what is Hong Kong’s official verbal Chinese language? Could that be Mandarin?

Let’s look at a few numbers. According to the Hong Kong government and its 2011 census, almost 90 percent of the Hong Kong population uses Cantonese as their usual language (meaning the primary language they use in daily setting); 3.2 percent of population speaks English; 5.5 percent speaks Chinese “dialects” other than Cantonese and Mandarin. How many people speaks Mandarin as their usual language? A mere 0.9 percent of the population. That is not to say that Mandarin is not important. However, I find it totally unconvincing to try to argue for a language spoken by just 0.9 percent of the population as the official language, while the one spoken by 90 percent is not.

Well, you may say, Hong Kong is a metropolis, so it should not be surprising that there are many Westerns who speak English as their first language. But if we narrow down and look only at the ethnic Chinese population (not necessarily legally Chinese, but people with Chinese origins, including American Chinese, etc.) in Hong Kong, we will see that Mandarin is still spoken by just a tiny fraction of ethnic Chinese.

We can further break down the ethnic Chinese population by their duration of residence in Hong Kong.

There we have more interesting findings. We see that the longer these ethnic Chinese lived in Hong Kong, the more likely they speak Cantonese as their usual language. Almost 95 percent of the ethnic Chinese population who have lived in Hong Kong for more than 10 years speak Cantonese as their usual language. While this does not necessarily mean that living in Hong Kong causes non-Cantonese speaking Chinese to speak Cantonese, I would argue that this is probably a persuasive story.

What may be worrying, however, is whether the future newcomers to Hong Kong would still be willing to learn Cantonese as the previous generations. In 2011, although almost 60 percent of the newcomers speaks Cantonese as their usual language, around 20 percent (the figure may be even higher in 2014) speaks Mandarin, which by no means is a small fraction. These people may easily stay within their comfort zone and speak only Mandarin with their Mandarin-speaking friends, and after a few years they may find that they still cannot speak Cantonese or make friends with the locals. In a decade later, Hong Kong may be split into two linguistic circles, and this is a ticking time bomb to our community cohesion in this political era.

Lehman Brothers: “Repo 105” recap

More than five years after Lehman Brothers collapsed, I decided to take a deep dive on the mechanics behind the derivatives world. One of the most interesting documents was the report by Lehman’s court-appointed bankruptcy examiner Anton R. Valukas, which runs 2,200 pages (disclaimer: I did not finish reading all!). The report shed light on accounting tricks and derivatives products that played an important role in the demise of Lehman, and in particular, pointed to an accounting trick now famously known as “Repo 105.” Named after a technical aspect of the gimmick, it helped Lehman temporarily remove about $50 billion of assets from its balance sheet, making it look better than it really was.

According to the examiner’s report:

Lehman did not disclose, however, that it had been using an accounting device (known within Lehman as “Repo 105”) to manage its balance sheet – by temporarily removing approximately $50 billion of assets from the balance sheet at the end of the first and second quarters of 2008. In an ordinary repo, Lehman raised cash by selling assets with a simultaneous obligation to repurchase them the next day or several days later; such transactions were accounted for as financings, and the assets remained on Lehman’s balance sheet. In a Repo 105 transaction, Lehman did exactly the same thing, but because the assets were 105% or more of the cash received, accounting rules permitted the transactions to be treated as sales rather than financings, so that the assets could be removed from the balance sheet. With Repo 105 transactions, Lehman’s reported net leverage was 12.1 at the end of the second quarter of 2008; but if Lehman had used ordinary repos, net leverage would have to have been reported at 13.9.

Similar to other repos (short for “repurchase agreements”), Repo 105 mechanics mirrors that of a short-term loan: exchanging collateral for cash up front, and then unwinding the trade as soon as overnight. Although repos and short-term loans have similar functions, they are vastly different from a legal perspective. A repo involves a sale — and later repurchase — of the collateral; the legal title of the collateral would be transferred. Accounting rules allow that Lehman to book the transactions as financings rather than sales as long as the assets were below 105 percent of the cash received. That was not what Lehman wanted, however: Lehman wanted it to be booked as a sale, so that on the balance sheet Lehman would appear that it was holding fewer assets, and hence less leveraged (given the same amount of capital).

Put these complex webs of transactions in one chart:

But what did the law say? According to the report,

Repos generally cannot be treated as sales in the United States because lawyers cannot provide a true sale opinion under U.S. law.

And hence there was no American law firm willing to sign off Lehman’s accounting practice. Here came Linklaters, a “Magic Circle” English law firm. According to the New York Times, Linklaters explicitly said:

“This opinion is limited to English law as applied by the English courts and is given on the basis that it will be governed by and construed in accordance with English law.”

Wow, it was really a well-carved caveat! The New York Times noted that Linklaters partner Simon Firth, who signed the document, is well known  in the industry for his work in securitization and derivatives, and has authored the textbook “Derivatives: Law and Practice.” No wonder he could have come up with such a brilliant idea. My guess is that even if Lehman had disclosed the use of Repo 105, it would take a microscope to read it or understand its impact. But guess what, Lehman did not even disclose it. According to the examiner’s report.

Lehman did not disclose its use – or the significant magnitude of its use – of Repo 105 to the Government, to the rating agencies, to its investors, or to its own Board of Directors. Lehman’s auditors, Ernst & Young, were aware of but did not question Lehman’s use and nondisclosure of the Repo 105 accounting transactions.

Alas, the ordinary citizens are rightfully not happy.

Chinese students abroad: No longer sought after?

The FT has an article featuring overseas Chinese students. According to the article,

The number of Chinese studying overseas has more than tripled in the past decade and continues to shoot up. The rise has been particularly dramatic among lower-middle-class families: according to a report from the Chinese Academy of Social Sciences, up to the end of 2009 students from such families made up only 2 per cent of all those who studied overseas, but by the end of 2010 the proportion had risen to 34 per cent.

But is it worth spending Rmb1m-2m ($165,000-$330,00) on preparing for and completing an overseas degree, only to return to a job market where seven million graduates cannot find jobs? … Jennifer Feng, chief human resources expert at 51job, the leading Chinese employment agency, says there is “no big difference between the starting salaries of those holding overseas or local university degrees”. Gone are the days when an overseas degree ensured a top-paying job.

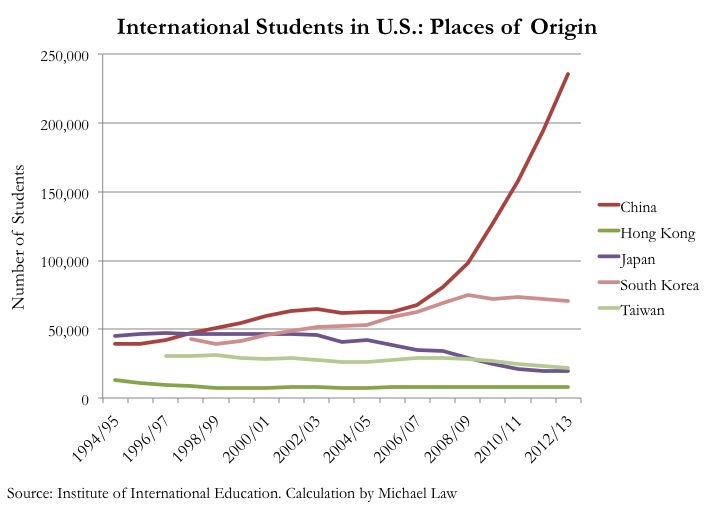
Indeed, the rise in numbers of Chinese students abroad is phenomenal. According to the Institute of International Education, in less than a decade, the number of Chinese studying in the U.S. has quadrupled, from a little over 60,000 in 2004, to almost 240,000 in 2013. This surge in number in a quite recent event — until 2006/07 the increase has been gradual, but after the global financial crisis, the rise has become exponential. China now accounts for almost one in every three international students in the U.S., a historic high for any country.

A simple supply-demand theory would say that when there are more foreign Chinese students, their “value” decreases. But it is premature to say that going abroad to study does not pay off. As a start, my (biased) personal experiences do not support the hard evidence that there are one Chinese in every three international students. At Harvard, although Chinese students represent the largest group of foreigners (at 686 students), my guess is that they represent at most only 10 percent of the foreign (defined as non-U.S.) population.

The equation does not add up if that is the case in all universities, so it must mean that many other schools have (much) higher concentration of Chinese students. These are, presumably, lower-ranked schools. The result is that the average quality of these overseas Chinese students people who have studied overseas – known as “haigui”, or sea turtles — must decrease. If education serves merely as a signal to distinguish out the smart kids, it should not surprise us that going to lower-ranked schools would not help boost your salary. In order words, it does not necessarily mean the premium — in terms of salary — of going abroad is decreasing; it may just mean that an average haigui is less talented than before.

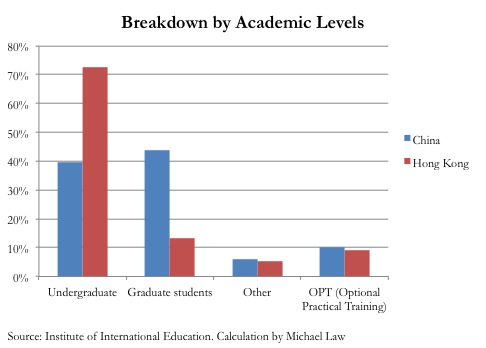
I’m guessing that same logic applies to Hong Kong students too, although the reverse is true. At graduate schools, I see very few Hong Kong students, and this is supported by data: only 13 percent of Hong Kong students in the U.S. are graduate students, whereas it is 44 percent for China. In 2012/13 there are 235,597 and 8,026 students in total from China and Hong Kong respectively, and a back-of-the-envelope calculation gives me 103,427 Chinese and 1,051 Hong Kong graduate students in the U.S. respectively — it is almost a 100 to 1 ratio!

Doing a graduate degree abroad is not a preferable route for most Hong Kong students, as they see the opportunity cost (e.g. forgone salary) of doing so is too high. Therefore, Hong Kong students would likely apply only to the top graduate schools, and/or do degrees that they see a direct pecuniary returns, like an MBA. That probably would bias update the average salary of Hong Kong students abroad? But why didn’t that incentivize more Hong Kong student to pursue graduate studies abroad? That I have no simple answer for now. But it is notable that Japanese students in the U.S. has almost halved in the past 15 years, when Japan has become a more inward-looking economy. It does not seem to be a coincidence that when a country assumes a more prominent role in the global economy, the number of students studying abroad also increases too. Hong Kong sees the number of its students to the U.S. dropping in the past 15 years, too, albeit at a lower rate. Alas, this may be a warning to Hong Kong.

Taxi economics: Lower fare and higher drivers’ income can coexist

The one thing I am impressed the most with my stay here in the US is the creativity and entrepreneurship of the young people. When there is a problem, there is always a solution–and people can make money from it. I once moaned about the difficulty of getting a taxi in Boston, and have recently found that a new (okay, it has been there for a while actually) mobile app called Uber is now transforming the entire cab industry, not just in the US, but perhaps globally. I have recently taken my first ride with Uber, and was pleasantly surprised by the quality and ease of service. For example, I didn’t have to pay the driver (directly); if you want to send your friend home, using Uber will certainly be easier than giving him/her a $50 bill. You can also split the fare easily for multiple passengers and forget about the inconvenience and embarrassment for chasing after your friend for a mere five bucks. As the Economist magazine noted, the idea is simple: “The app makes it easier to bring together drivers, whose cabs are often empty, and passengers. Time and fuel are saved. Money is made.”

As I dug deeper to understand the business model of Uber, I am (again) surprised to learn that Uber has indeed been already running in 65 cities in 23 countries (growing from 49 cities in 19 countries just two months ago). In Asia, it runs in Taipei, Shanghai, Toyko, Seoul, Guangzhou and even Shenzhen… but not Hong Kong. Perhaps it is because it is easy enough to get a taxi in Hong Kong already? But look, Uber is also operating in big cities like New York and London. Hailo, a similar app founded in London by cabbies and techies three years ago, says 60% of the city’s black-cab drivers are now on its books. Well, to be precise, Hailo and Uber are similar apps but their business models are quite different. As the Economist magazine explained:

Wherever it goes, Hailo works only with taxis that may be hailed in the street. It starts by signing up cabbies, who have their own app on which they can record journeys and fares, and which alerts them to “bursts” of demand (as people leave a concert, say). The app for passengers comes later… Cabbies will earn points for accepting “e-hails” when demand is at its peak and work is easy to find on the street; the highest scorers will have priority when work is scarce…

Uber has chosen the route of competition rather than co-operation with local cabbies and taxi firms. Most of its business is with town cars and sport-utility vehicles. A cheaper range, uberX, competes directly with ordinary cabs. Parisians may plump for a two-wheeled uberMOTO. In a few cities, though, it has a cab service, uberTAXI, working with local operators.

But in any case, these mobile apps are distorting how the taxi industry has been running for ages. Without doubt, this would create unease to the incumbents. It is only natural to expect that the existing taxi operators would do whatever it takes to stop them, including lobbying the governments. As the Economist wrote on:

Taxi operators have lobbied municipal regulators furiously to keep the invader out. Customers may purr about the ease of summoning a smart town car, especially where taxis are old, dirty or scarce. Yet the regulators are often sympathetic to the taxi companies’ pleas. However, a Californian regulator recently approved another upstart model, ride-sharing, exemplified by Lyft, a San Francisco firm: private drivers offer rides in their own cars in exchange for a “donation”. Local taxi groups have vowed to fight on.

Uber has had to battle in Washington, DC, where the local taxi commission tried in effect to stop it from using small, low-emission cars. In Houston, Miami and Portland Uber is being thwarted by regulators requiring it to charge minimum fares of up to $70 and to make bookings at least 30 or 60 minutes before a trip. Travis Kalanick, Uber’s founder, has promised to spend some of the $258m raised this summer on fighting off “protectionist, anti-competitive efforts” as well as on expanding into new markets.

And regulators, who doubt the legality of these apps and say new laws are required to protect consumers from being harmed by such apps, are proposing numerous guidelines (perhaps after being lobbied by the existing taxi operators) that would effectively force Uber to cease operations in the United States. As the New York Times reported, Uber is facing lawsuits filed by San Francisco cabdrivers and Chicago car service companies, and a $20,000 fine from the California Public Utilities Commission.

But what is truly interesting to me is that–somewhat contrary to my perception–Uber can actually raise taxi drivers incomes, not lower them over time. As noted by Felix Salmon:

The key datapoint came in October, when Uber said in a blog post that when it lowered fares for its UberX product, its drivers’ income actually went up rather than down: in Boston, it rose by 22% per hour, which is a lot of money. The result has been that UberX is now priced near or below prevailing taxi rates in most cities: in Washington DC, for instance, UberX costs 18% less than a taxi. And the drivers of those cars are making significantly more money than they would make if they were driving a cab. 

This has important public policy implications for Hong Kong, where taxi drivers hardly shared the benefits of a regular rise in taxi fare because the the cost of leasing a cab will rise too (while at the same time the amount of passengers would decrease). This is very much a simple economics lesson about “elasticity”, or in plain language, “bargaining power”. As Felix Salmon explains:

[I]n this case, the cab drivers — at least the ones who lease their cabs on a per-shift basis — should think of themselves less as small business owners, selling their services to passengers, and more as valuable employees, selling their services to either taxi-fleet owners or to companies like Uber. Looked at that way, more competition means higher wages, not lower income.

Precisely because taxi fares are highly regulated, cab drivers have historically had almost no bargaining power when it comes to their own income. The fares are set, and even if fares rise, the fleet owners will waste no time in taking advantage of that rise in fares to simply raise the cost of leasing a cab. Especially in New York, where there’s a limited number of medallions, anybody who wants to drive a taxi basically has to just accept whatever deal is offered.

The taxi industry in Hong Kong is among one of the most highly regulated industries in Hong Kong, with the government stopping issuing licenses in 1994, limiting entrants, and fixing taxi fares (drivers cannot cut fare). Existing licenses are transferable and tradable, but given limited supply, their prices have doubled in the past five years, to HK$7 million (almost US$1 million). Hong Kong may not need more taxis, but new competition from the tech companies can change how the industry is structured, and would likely raise the welfare of the taxi drivers. It would be interesting to see whether the Hong Kong government has the political will to push through the changes.

The economics profession: Why are there star economists?

This is a small world, as we know it. Most people are connected through the so-called “six degrees of separation”. But what does it mean for our professional life? Researchers have found very short paths in collaboration networks within professional communities. There is a “connection” if two authors have collaborated/coauthored before. A “path” means the degrees of separation between any two authors. My coauthor and I have a “distance” of one. The distance between me and my coauthor’s coauthor is two, and so on.

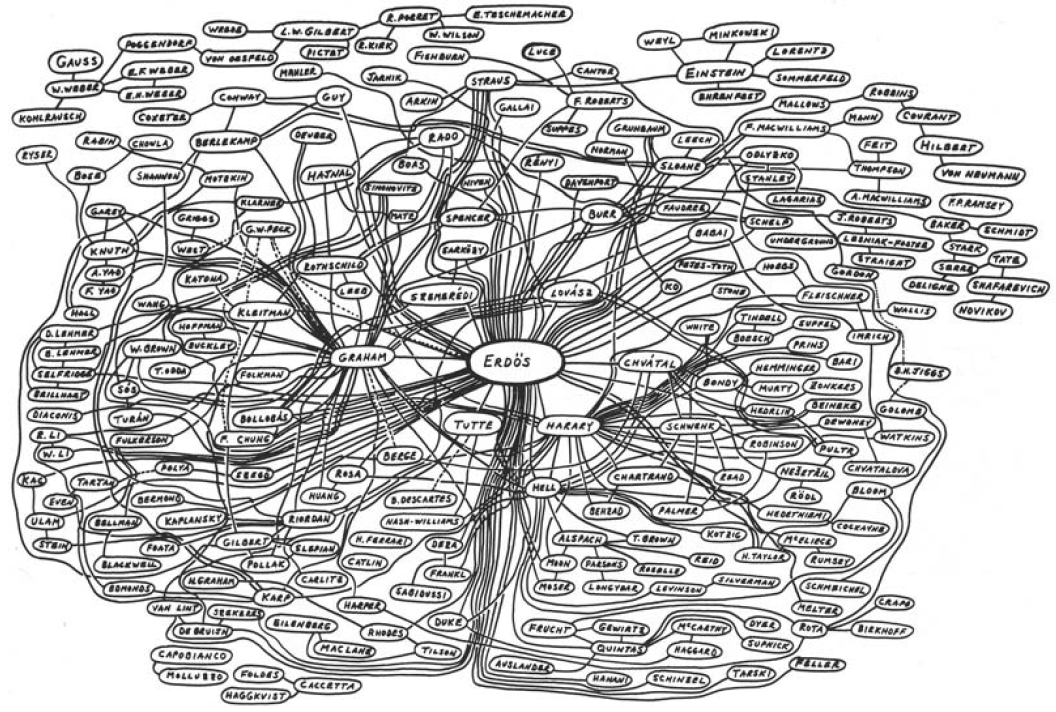
So how short are the paths? In the domain of mathematics, for example, the genius-mathematician Paul Erdös, who has written 1,500 papers over his career, is often considered the central figure of the collaborative structure of the field. The figure below (yes, it is messy) depicts a collaborative graph for Paul Erdös, with him in the center. A mathematician’s Erdös number is the distance from him/her to Erdös. It is found out that most mathematicians have a Erdös number of at most 4 or 5. And it is not just mathematics — it is found that the Erdös number of other science field (e.g. physics) is comparable or even smaller.

Figure 1: Paul Erdös’s collaboration graph

Sources: Easley and Kleinberg (2010)

As an economist by training, I’m more interested to learn about the Erdös number for the economics profession. According to Goyal et al., this average distance was 12.86 in the 1970s, 11.07 in the 1980s, and 9.47 in the 1990s. This is a relatively high number comparing to the science field possibly because economics is “separated” into many subfields — a microeconomist is unlikely to collaborate with a macroeconomist, for example. But it is also notable that the distance has decreased by 25 percent in the two decades (I guess the distance is even smaller in the 2000s), which means the economists are more connected, or put it another way, there are more coauthorships happening.

A few star economists have a lot of connections. On the surface, it should not be that surprising because these economists should have written a lot of papers, which is how they become famous in the first place. But what is interesting actually is that the star economists’ coauthors have few coauthors and do not coauthor among each other. See, for example, the coauthorship graph for Joseph Stiglitz in the 1990s. It can be clearly seen that Stiglitz is at the center of a network of people. If we take Stiglitz out, the giant component would break down into many small pieces. This is quite different from the usual social network that we see in life, where you friends’ friends tend to be friends with each other, or put it in another way, they would “cluster” together.

In the words of Goyal:

We find that the removal of 5 percent of the authors at random leads to a marginal change in the giant component and clustering, whereas the deletion of the 5 percent most linked nodes leads to a complete breakdown of the giant component and a sharp increase in the clustering coefficient… We therefore conclude that the world of economists has been and still is spanned by a collection of interlinked stars and that this is critical for understanding the short average distances.

Figure 2: Local network of collaboration of Joseph E. Stiglitz in the 1990s

Sources: Goyal (2006)

I’m thinking that the aspiring economists would naturally want to coauthor with star economists, even if, in practice, the aspiring economists may have to do most of the work. Put it in another way, once you get famous, there will be other people who would be willing to share their coauthorship with you, and you can easily produce more papers. This is a very much “the rich get richer” situation (which happens a lot in other kinds of networks too). I have not looked into the situations in other social science subjects, but I would image that the network structures are similar.

This may explain the hierarchy of the economics profession. I’m fortunate to be surrounded by many of these star economists here at Harvard. Well, I think I should start working with them too.

Optimal control theory: Embracing it in monetary policy

I still remember the days of studying dynamic optimization in my advanced macroeconomic class in the MPA/ID program. A few students like myself once moaned about the difficulty and “irrelevance” of dynamic optimization to the real world. Indeed, “optimal control”, a key approach to dynamic optimization, was developed in the 1950s during the space race, and it appears to be so remote from my daily life.

Not anymore.

Using the “optimal control” approach, two new working papers written by Federal Reserve staff — “Aggregate Supply in the United States: Recent Developments and Implications for the Conduct of Monetary Policy” and “The Federal Reserve’s Framework for Monetary Policy – Recent Changes and New Questions” — have attracted significant market attention this week, because they suggest a lower unemployment rate of 5.5% (rather than the 6.5% set out by Bernanke earlier) before triggering a tightening of policy, while also tolerating a higher rate of inflation of around 2.5% (which is higher than the informal inflation target of 2%).

But the true reason markets are listening to these two workings papers (which do not necessarily reflect the Fed’s view) is that it precisely coincides what the (likely) incoming Fed chairwoman Janet Yellen has on her mind. More than a year ago, she has already promoted “optimal control” as an alternative approach to set monetary policy. According to her speech:

Although simple rules provide a useful starting point in determining appropriate policy, they by no means deserve the “last word”–especially in current circumstances. An alternative approach, also illustrated in figure 10, is to compute an “optimal control” path for the federal funds rate using an economic model–FRB/US, in this case.

This basically says that Yellen may want to keep the interest rate longer (see the green line) than standard economic theory (in particular the Taylor rule, the red line) would imply. I read this as saying the Fed may not raise interest rate until 2017 (which would seriously put emerging markets into a “hot” spot), as Yellen suggested that this would be more effective in bringing down unemployment.

Figure 11 shows that, by keeping the federal funds rate at its current level for longer, monetary policy under the balanced-approach rule achieves a more rapid reduction of the unemployment rate than monetary policy under the Taylor (1993) rule does, while nonetheless keeping inflation near 2 percent. But the improvement in labor market conditions is even more notable under the optimal control path, even as inflation remains close to the FOMC’s long-run inflation objective.

So expect “optimal control” to be the new buzzword in finance, and be ready to embrace it! I would expect more investors and pseudo-economists will be looking up its definition on Wikipedia this week, as Janet Yellen will appear before the Senate Banking Committee’s  confirmation hearing on Thursday. I have put below my favorite definition by Gavyn Davies:

Optimal control is a method which has been borrowed by economists from applied mathematics and sciences, notably engineering. In the field of monetary economics, it involves taking a macro-economic model, and running multiple simulations (sometimes in the millions), using different combinations of interest rates and the Fed balance sheet to derive projected time paths for the central bank’s objectives (inflation and unemployment) in the years ahead. The simulation which produces the best outcome for the Fed’s objectives is then used to select the optimal setting for policy.

Let’s wait and see what the U.S. senators can learn from Yellen in a few days.

Institutional reforms: Easy said than done

Institutional reforms are the buzzwords in developments nowadays. Daron Acemoglu and James Robinson’s best-selling Why Nations Fail is all about institutions: the balance between inclusive versus exclusive political and economic institutions would determine the development path of countries. Indeed, the full name of the book is Why Nations Fail: The Origins of Power, Prosperity, and Poverty

(I don’t quite agree with the over-simplifying theory of Acemoglu and Robinson, however. And I’m not the first one: Microsoft’s billionaire founder Bill Gates’s review of the book said that “the book is a major disappointment”, and he “found the authors’ analysis vague and simplistic” (which I agree). Acemoglu and Robinson responded in the Foreign Policy, saying that “Gates’s review is disappointing”, and asked “Did the Microsoft founder even read our book before he criticized it?” The whole debate worths another blogpost to discuss, so I will leave it for now.)

The World Bank and other development agencies are spending huge amount of money on building these institutions. Nevertheless, according to Matt Andrews, an associate professor at Harvard Kennedy School, evaluations by the multilateral and bilateral organizations reveal that “as many as 70% of reforms seem to have muted results”. But why is it so? According to Andrews, the problem is that many policymakers adopt institutional reforms to just “signal” their intent to reform, and many times these reforms use “best practice” solutions from a third country that has a different context to the one that the policymaker is facing.

I argue that these reform limits fester across the developing world because institutional reforms are commonly adopted to signal the intent to reform, not as efforts to actually change governments. The problem with reforms as signals is that they are frequently not capable of being implemented. They are devised with little attention to the contextual realities that actually shape (and constrain) change opportunities, promise overly demanding “best practice” solutions that look impressive but are commonly impossible to reproduce, and are negotiated with narrow sets of champions who seldom have enough influence to make change happen (especially with the distributed groups of agents who ultimately have to live with and implement new rules of the game).

Andrews, together with Lant Pritchett and Michael Woolcock, both of the HKS, came up with a concept called “problem-driven iterative adaptation“, or PDIA. The so-called PDIA approach 1) “focuses on solving locally nominated and defined problems in performance (rather than transplanting packaged “best practice” solutions); 2) seeks to create an authorizing environment for decision-making that encourages “positive deviance” and experimentation; 3) embeds this experimentation in tight feedback loops that facilitate rapid experiential learning; and 4) actively engages broad sets of agents “to ensure that reforms are viable, legitimate, relevant, and supportable”.

In the words of Andrews:

This type of change notes that more successful reforms are sparked by problems that people cannot ignore (not best practice solutions that outsiders say are important). The reforms emerge as groups of agents address these problems, in an iterative process of experimentation, learning and adaptation (not as singular champions commit to pre-designed reform models). Each step in the reform process allows reformers to learn more about how to solve their problem, build political support for the change process they are advocating, and establish new capacities required to implement this change.

The whole idea, I think, is extremely simple: context matters, so don’t just transplant a “best practice”. But the international development community likes to find “models” of development, and in the past decades we have witnessed “consensuses” ranging from the “Washington Consensus” to the “Beijing Consensus”. In that sense, PDIA may be just another acronym too (which academics like to create). After all, development is complicated, and people feel unsecured without having a “model” in mind. Professionals and consultants also feel obliged to sell a “best” solution because this shows their value (image a consultant comes in and says, “well, I don’t actually what is best for you”), though in the real world there may be only an “acceptable” solution. In practice, getting away from a “best practice” mentality is still easier said than done.